🧬 Spector Cortex — Neural Dashboard & Chat UI
The Vision
What if you could watch your AI's brain think and talk to it at the same time? Spector Cortex is a real-time neural dashboard and cognitive chat interface — from SIMD lanes firing to Hebbian edges strengthening to memories decaying along the Ebbinghaus curve. It's the difference between a black box and a living brain.
Two Faces of Cortex
Cortex serves two purposes in the Spector ecosystem:
1. Neural Dashboard (Visualization)
The original Cortex — 12+ live cognitive panels for monitoring and debugging the memory engine:
| Panel | What It Shows |
|---|---|
| Neural Graph | 200-node cognitive network with Hebbian, temporal, and entity edges |
| Vector Space | 300-point PCA-projected embedding space with query dot and k-NN lines |
| Scoring Pipeline | The 6-phase cognitive scoring funnel animated in real time |
| Live Metrics | Real-time recall/remember/reinforce/forget rates |
| Cognitive Profile | 6-axis radar showing thalamic modulation parameters |
| SIMD & Hardware | 16-lane SIMD register visualization |
| Memory Heatmap | Off-heap memory segment utilization across all 4 tiers |
| Decay Curve | Ebbinghaus forgetting curve vs. LTP reconsolidation |
| Habituation | Anti-filter-bubble mechanism gauges |
2. Cognitive Chat Interface (Agent Interaction)
The new Cortex — a fully-featured chat interface powered by Spector Synapse:
| View | Description |
|---|---|
| Chat | Conversational interface with memory-primed responses, streaming, and context indicators |
| Memories | Browse, search, and manage cognitive memories with tier filtering and importance visualization |
| Agents | Create, configure, and manage autonomous agents with soul editing |
| Connectors | Set up and monitor data connector integrations |
| Settings | Configure providers, API keys, and system preferences |
Technology Stack
| Layer | Technology |
|---|---|
| Framework | Angular 22 (standalone components, signals) |
| Styling | SCSS with Material Design 3 tokens |
| 3D Rendering | THREE.js + Canvas API |
| State Management | Angular Signals |
| HTTP | httpResource + HttpClient |
| Build | Angular CLI 22, Vitest |
Visual Showcase
🎥 Neural Graph in Action
The 3D neural graph explorer — fly through the cognitive galaxy, explore Hebbian associations, temporal chains, and entity relationships as glowing star constellations.
📊 Dashboard — 12+ Live Cognitive Panels
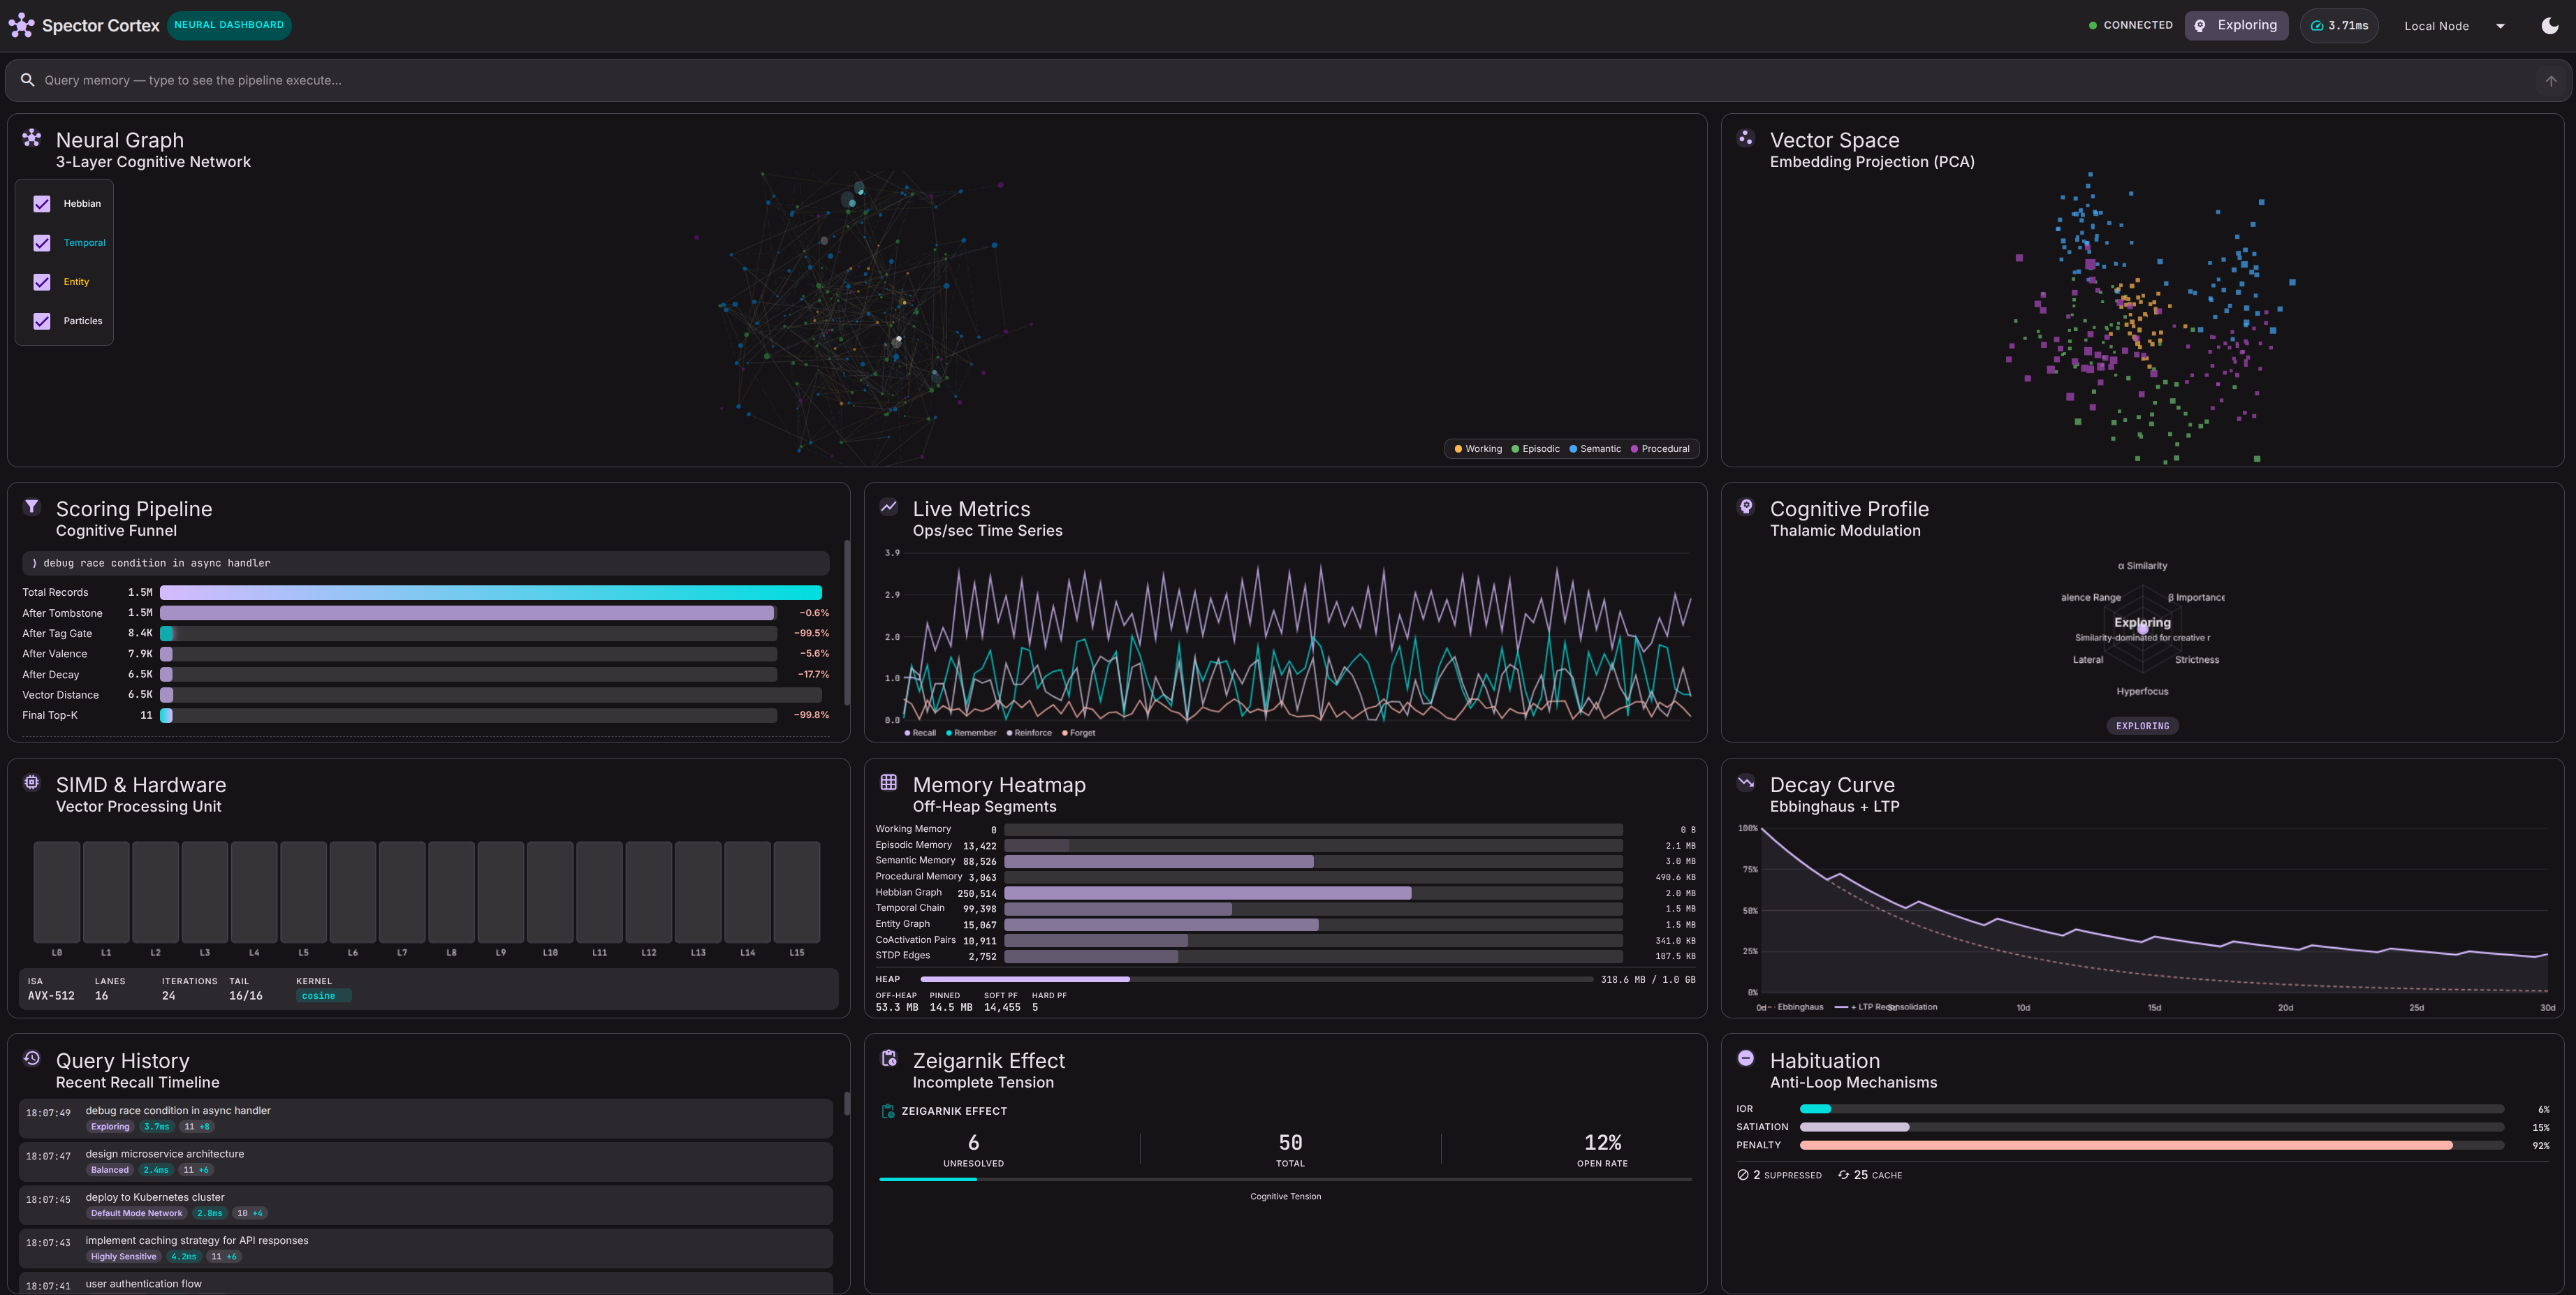
Real-time scoring pipeline, SIMD lanes, decay curves, vector space, Hebbian graph, cognitive profiles, and live metrics — all rendered in a single interactive dashboard.
🌌 Graph Explorer — 3D Neural Galaxy
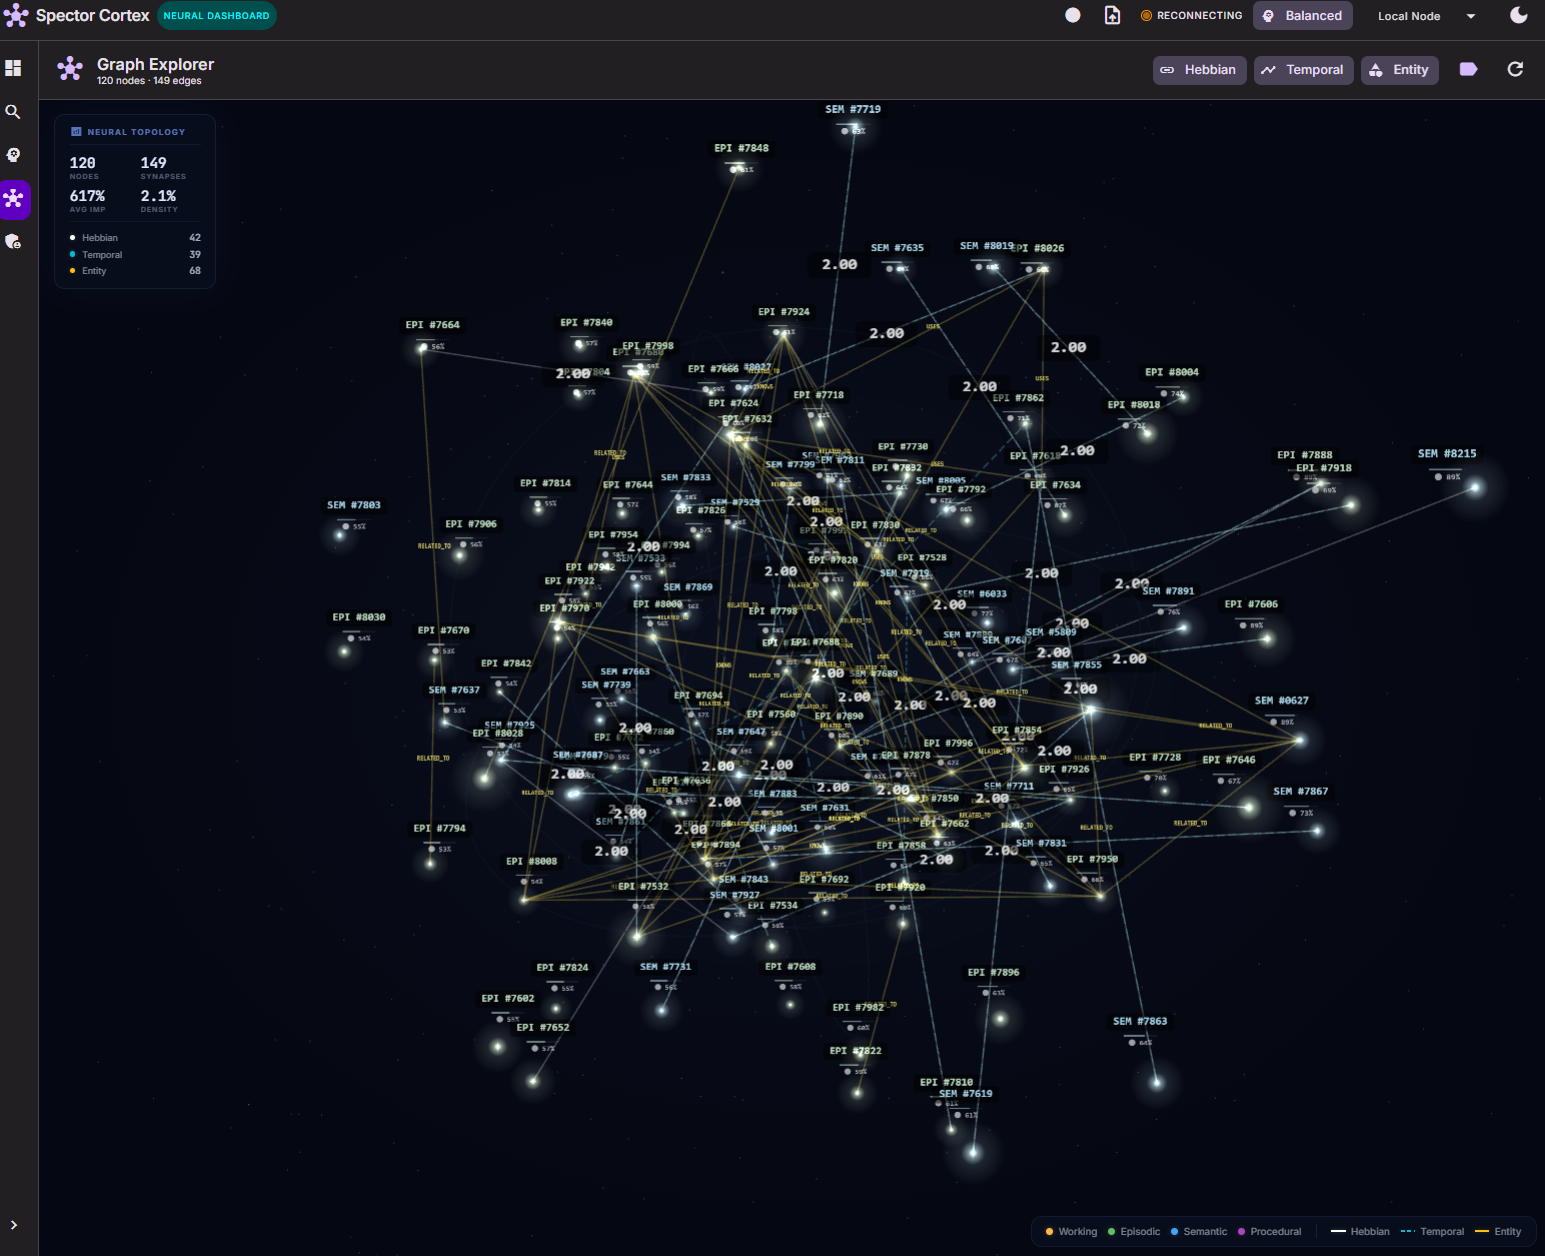
Interactive 3D graph with glowing star nodes, Hebbian/temporal/entity edges, fly-to navigation, click-to-explore, and real-time topology stats.
🧠 Memory Table — Browse & Manage Memories
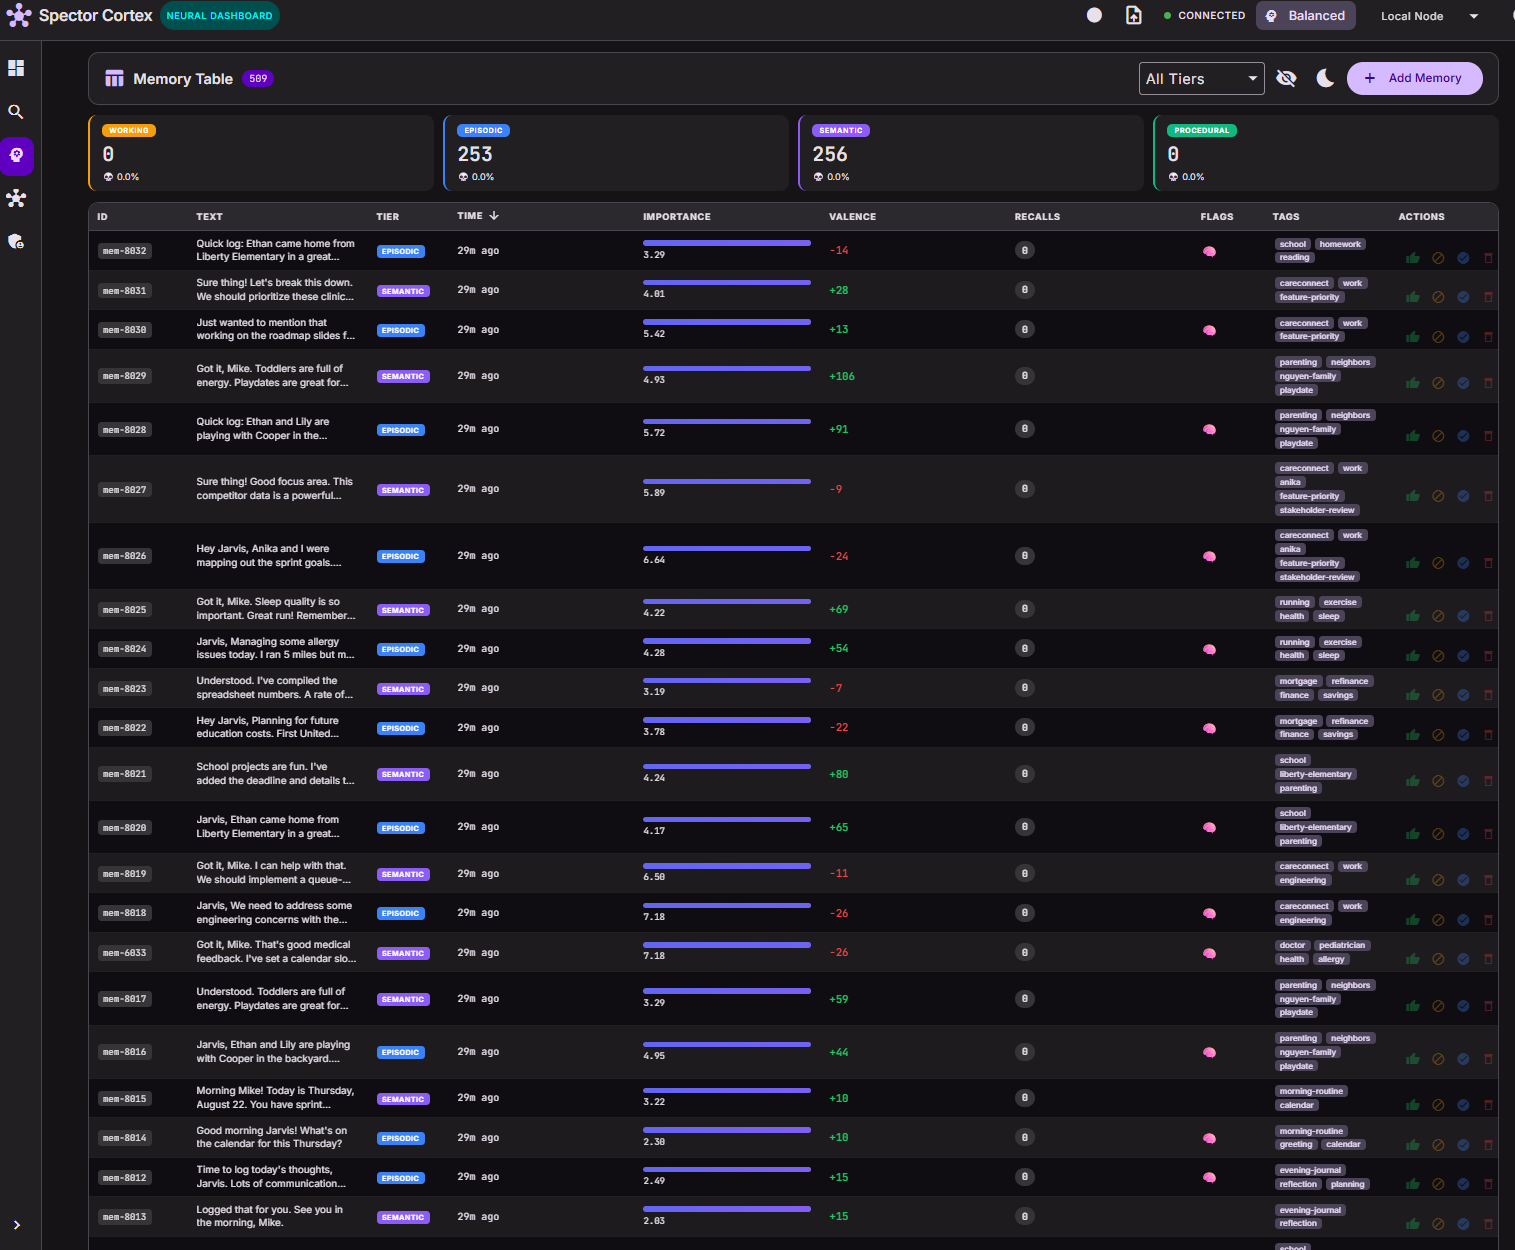
Full CRUD with tier filtering, importance bars, valence indicators, synaptic tags, recall counts, tombstone ratios, and bulk actions.
🔬 Memory Detail — Deep Cognitive Inspection
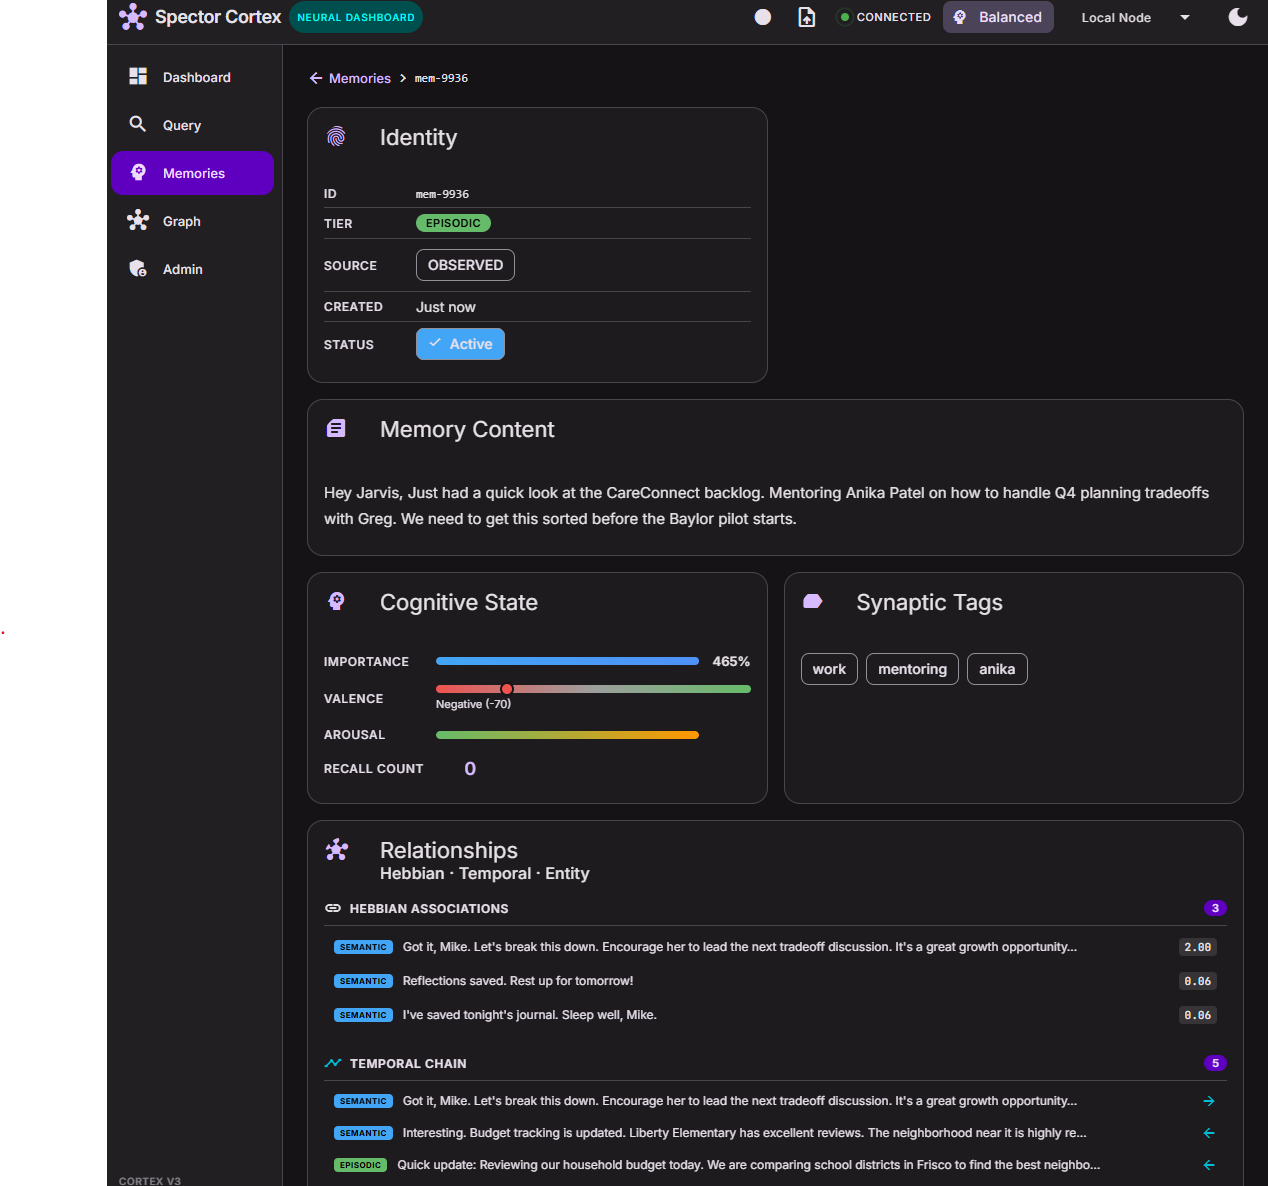
Identity card, cognitive state (importance/valence/arousal gauges), synaptic tags, and full relationship graph showing Hebbian associations, temporal chains, and entity links.
What's Coming to Cortex
Near-Term (In Progress)
- Chat streaming UI — real-time token rendering with typing indicators
- Agent soul editor — visual editor for agent personality and tools
- Connector dashboard — sync status, data volume, and health monitoring
- Dark mode — full dark theme with M3 design tokens
- Mobile responsive — responsive layouts for tablet and phone
Medium-Term (Planned)
- Conversation timeline — visual timeline of agent-user interactions
- Memory graph explorer v2 — filter by conversation, time range, or agent
- Agent template marketplace — browse and install community templates
- Real-time collaboration — multiple users in the same conversation
- Accessibility — WCAG 2.1 AA compliance
Long-Term (Vision)
- Voice interface — speech-to-text chat with agent responses
- Cognitive replay — replay past cognitive states step by step
- Comparative agent view — side-by-side agent behavior comparison
Building
cd spector-cortex

# Install dependencies
npm ci

# Development server (http://localhost:4200)
ng serve

# Production build
ng build --configuration production

# Run tests
ng test
License
Spector Cortex is licensed under the Business Source License 1.1 (BSL 1.1).
- Change Date: July 6, 2030
- Change License: Apache License, Version 2.0
See LICENSE for full terms.